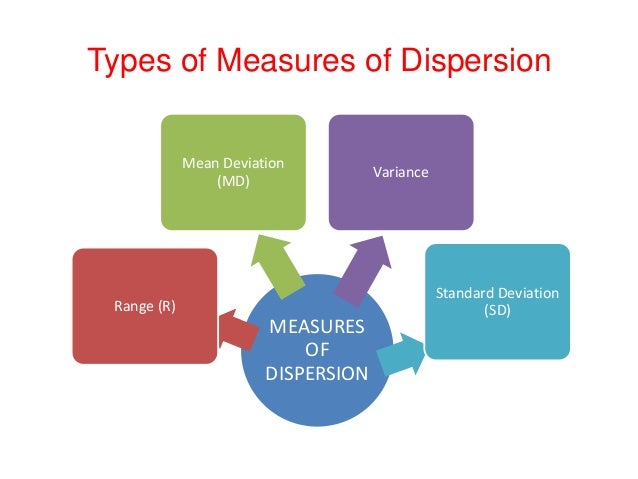
Measures of Dispersion
Inter-Quartile Range (IQR)

Standard Deviation

- Indicate how large the spread of the distribution is around the Central Tendency
- Answers the question - "What is the magnitude of departure from the average value for different groups having identical averages?"
- Are the summary measures used to measuring the variations in the data.

- Calculated as the difference between maximum and minimum value in the data-set
- Range = X(max) - X(min), where X is the given data-set
- For example, consider the following data-set:
- 12, 4, 5, 6.8, 8, 10.1, 22, 18.9
- Range = 22 - 4 = 18
- CAUTION: If Max or Min value is a outlier, then Range usage should be avoided.
Inter-Quartile Range (IQR)
- Also called Mid-Range
- Is the difference between the data-set values at 75 percentile and 25 percentile
- Data-set should be arranged in ascending order of magnitude
- NOTE: Resistant to outliers
- If Q3 is 75th percentile and Q1 is the 25th percentile, then IQR = Q3 - Q1
- For example, consider the following un-ordered data-set:
- 12, 4, 5, 6.8, 8, 10.1, 22, 18.9
- First order the data-set: 4, 5, 6.8, 8, 10.1, 12, 18.9, 22
- Q1 = 5, Q3 = 12. Therefore, IQR = Q3 - Q1 = 12 - 5 = 7
Standard Deviation
- Standard Deviation is a measure of Risk and Volatility associated with any activity
- To define Standard Deviation, we need to first define Variance. Standard Deviation is square-root of Variance
- For example, consider the following un-ordered data-set X = 12, 4, 5, 6.8, 8, 10.1, 22, 18.9
- First calculate the Mean(X-bar) = (12 + 4 + 5 + 6.8 + 8 + 10.1 + 22 + 18.9)/8 = 10.85
- Variance = SUM([X - X-bar] pow 2)/(n - 1), where n is data-set size
- Therefore, Variance = [(12 - 10.725) pow 2 + (4 - 10.725) pow 2 + (5 - 10.725) pow 2 + (6.8 - 10.725) pow 2 + (8 - 10.725) pow 2 + (10.1 - 10.725) pow 2 + (22 - 10.725) pow 2 + (18.9 - 10.725) pow 2]/(8 - 1) = 296.68/7 = 42.38286
- Standard Deviation = SQRT(Variance) = SQRT(42.38286) = 6.510212
- Coefficient of Variation is defined as the ratio of Standard Deviation to Mean
- Coefficient of Variation is relative Standard Deviation
- For example, consider the following data for two Sales Persons calculated for the given year:
- Sales Person 1: Mean Sales = 50 units, Standard Deviation = 5 units, CV = 5/50 = .10 or 10%
- Sales Person 2: Mean Sales = 75 units, Standard Deviation = 25 units, CV = 25/75 = .33 or 33%
- Inference is, even though Sales Person 2 has achieved higher sales, his performance is not consistent over the given year
Comments
Post a Comment